For as long as humans have gazed up at the night sky, we’ve been captivated by the stars. Ancient cultures mapped their positions, told myths about their formations, and even used them to navigate vast oceans. But beyond their glittering beauty, stars hold secrets—secrets about the origins of the universe, the life cycles of celestial bodies, and the very building blocks of existence.
Yet, there’s a problem. The stars are far away. Too far. We can’t reach out and touch them, collect samples, or scoop up pieces for examination in a laboratory. So how do we study something we can’t physically access?
The answer lies in their light.
Every star, planet, nebula, and galaxy shines light toward us. And hidden within that light is a coded message. A message that, if deciphered, reveals incredible secrets about the object that emitted it: its temperature, its composition, its motion, its age, and even its past and future.
The tool astronomers use to crack this cosmic code is spectroscopy. It’s the art and science of analyzing light and using it to understand the universe. Spectroscopy doesn’t just tell us what we’re looking at; it tells us what’s going on inside. It turns the night sky from a silent picture into a story filled with action, transformation, and discovery.
Welcome to the world of astronomical spectroscopy—where decoding starlight is like reading the autobiography of the cosmos.
A Brief History of Light and Spectra
Before we dive into modern spectroscopy, it’s worth understanding how humanity got here. How did we realize that light carried secrets? Who first noticed there was more to sunlight than meets the eye?
The Birth of Spectroscopy: Rainbows and Revelations
Long before spectroscopy had a name, people noticed one of its most enchanting phenomena: the rainbow. When sunlight passes through raindrops, it bends (refracts), splits, and spreads out into a band of colors—red, orange, yellow, green, blue, indigo, and violet.
In 1666, Isaac Newton took this familiar sight and gave it a scientific twist. Using a glass prism in his lab, Newton demonstrated that sunlight wasn’t pure white, but was made up of many different colors. When he shone light through the prism, it spread out into a continuous spectrum of colors, a word meaning “appearance” or “apparition” in Latin.
Newton believed light was composed of particles (a “corpuscular” theory), but his experiments laid the groundwork for understanding light’s complexities. For more than a century, scientists studied light as a continuous spectrum—a rainbow of color without interruption.
The Mysterious Dark Lines: Enter Fraunhofer
In the early 1800s, a German optician named Joseph von Fraunhofer made a curious discovery. While studying the Sun’s light with a more refined prism and a telescope, he noticed that the solar spectrum wasn’t perfectly smooth. Instead, it was interrupted by hundreds of dark lines—specific wavelengths where light seemed to be missing.
These lines, later called Fraunhofer lines, puzzled scientists. Why were certain colors missing from the Sun’s light?
Fraunhofer didn’t understand the cause, but he meticulously cataloged these lines with extraordinary precision. His work provided the first map of the solar spectrum—a roadmap that would later lead to one of the greatest scientific revolutions in understanding starlight.
The Codebreakers: Kirchhoff and Bunsen
The answer came in the mid-19th century, thanks to two German scientists: Gustav Kirchhoff and Robert Bunsen (yes, the same Bunsen of Bunsen burner fame).
While studying the colors produced by heating chemical elements in flames, Bunsen and Kirchhoff discovered something amazing. Each element, when heated, emitted light at specific, unique wavelengths—like a barcode. Sodium, for example, produced bright yellow lines. Hydrogen, vivid red and blue. These emission lines matched up exactly with some of Fraunhofer’s dark lines.
Kirchhoff and Bunsen realized that the dark absorption lines in the Sun’s spectrum were caused by cooler gases in the Sun’s outer atmosphere absorbing specific wavelengths of light. Essentially, the Sun’s light was filtered by the elements it contained.
This was groundbreaking. For the first time, scientists could determine the chemical composition of something they could never touch—the Sun. Spectroscopy had officially become a tool for remote sensing of the stars.
How Spectroscopy Works—The Science Behind the Rainbows
At its core, spectroscopy is the study of how light interacts with matter. But how does it actually work?
Light, Wavelength, and Energy
Light isn’t just what we see. It’s a form of electromagnetic radiation—energy that travels in waves. The color of light depends on its wavelength: longer wavelengths appear red, while shorter wavelengths appear blue or violet.
Visible light is only a tiny part of the entire electromagnetic spectrum, which also includes:
- Radio waves (longest wavelength)
- Microwaves
- Infrared
- Ultraviolet
- X-rays
- Gamma rays (shortest wavelength)
Astronomers use all of these wavelengths to study the universe, but visible light was where spectroscopy began—and where much of its beauty still lies.
Atoms and Light: The Quantum Connection
The key to spectroscopy is understanding how atoms and light interact. Every atom is made of a nucleus (protons and neutrons) surrounded by electrons. These electrons exist in specific energy levels or orbits.
When an electron absorbs energy, it can jump to a higher energy level. But it doesn’t stay there for long. It eventually falls back to its original level, releasing energy in the form of a photon—light. The amount of energy released determines the photon’s wavelength.
Each type of atom has its own unique energy levels, which means it emits or absorbs light at specific wavelengths. These unique patterns are called spectral lines, and they serve as fingerprints for each element.
The Three Types of Spectra
- Continuous Spectrum: Produced by hot, dense objects like the cores of stars or incandescent solids. This spectrum shows a seamless rainbow of color with no breaks.
- Emission Spectrum: Produced by hot, low-density gases. These appear as bright lines at specific wavelengths on a dark background, corresponding to the energy released by electrons falling back to lower energy levels.
- Absorption Spectrum: Produced when a continuous spectrum of light passes through a cooler gas. The gas absorbs specific wavelengths, leaving dark lines in the continuous spectrum. These dark lines tell us what elements are present.
The Astronomer’s Toolkit—Instruments of Spectroscopy
Spectroscopy wouldn’t be possible without instruments that can split light into its component wavelengths and record the results.
Prisms and Gratings: Breaking Light Apart
In Newton’s day, a simple glass prism was enough to spread sunlight into a rainbow. Modern spectroscopy, however, relies mostly on diffraction gratings—surfaces covered with fine lines that cause light waves to interfere and spread out into a spectrum. Gratings can produce much higher resolution spectra than prisms, allowing astronomers to detect fine details.
Telescopes and Spectrographs: Collecting and Analyzing Light
A spectrograph is an instrument attached to a telescope that captures incoming light, separates it by wavelength, and records the resulting spectrum. The basic components include:
- A slit to admit a narrow beam of light
- A collimator lens or mirror to direct the beam
- A diffraction grating or prism to disperse the light
- A detector (like a CCD camera) to capture the spectrum
The more light the telescope collects, the better the quality of the spectrum. That’s why large observatories like the Keck Observatory in Hawaii or the Very Large Telescope (VLT) in Chile are so important—they can gather enormous amounts of light from distant stars and galaxies.
Spectroscopy in Action—What We’ve Learned from Starlight
Spectroscopy has revolutionized our understanding of the universe. Here are some of the ways it’s transformed astronomy.
1. Identifying the Chemical Makeup of Stars
By comparing a star’s absorption lines to known laboratory spectra, astronomers can determine exactly what elements are present in the star’s atmosphere. The Sun, for example, is composed mostly of hydrogen (about 74%) and helium (about 24%), with trace amounts of heavier elements like oxygen, carbon, and iron.
This ability to read a star’s “ingredients” is critical for understanding stellar evolution—how stars form, live, and die.
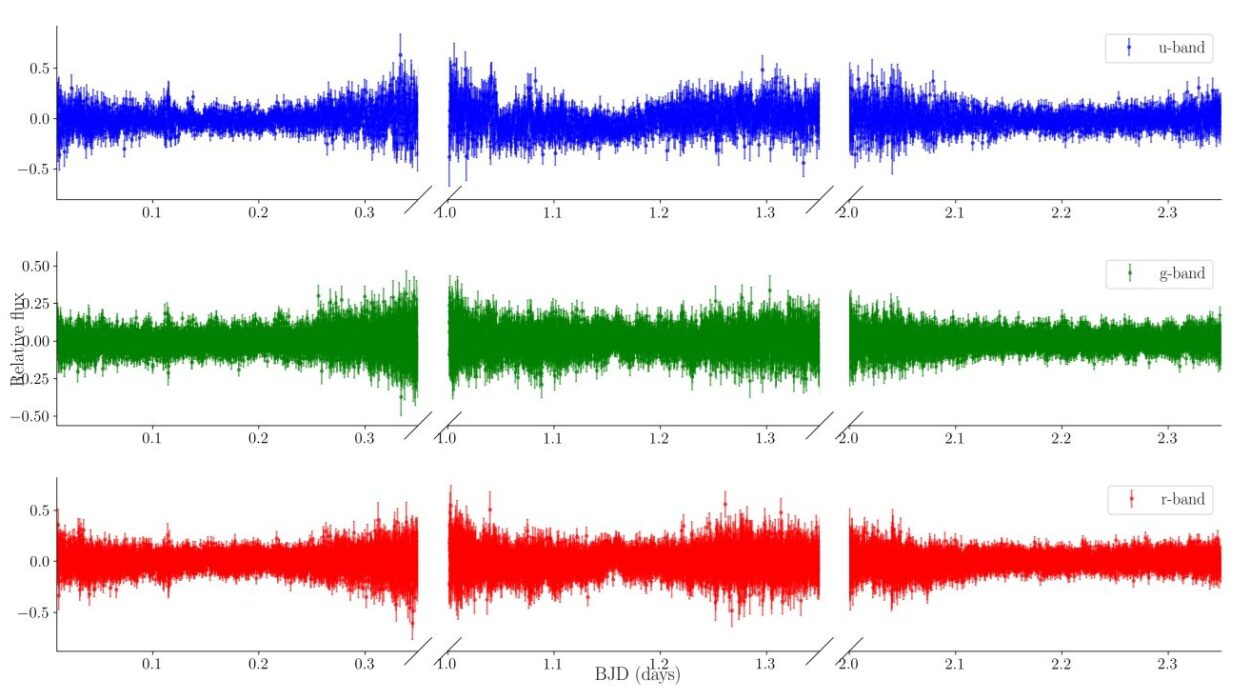
2. Measuring Temperature and Density
The strength and width of spectral lines can reveal a star’s temperature and density. Hotter stars have more ionized atoms, resulting in different spectral lines. Cooler stars show lines from neutral atoms and even molecules.
3. Determining Motion: The Doppler Effect
Spectroscopy can reveal whether a star or galaxy is moving toward or away from us. When an object moves away, its spectral lines shift toward longer wavelengths—this is called redshift. If it’s moving toward us, the lines shift toward shorter wavelengths—blueshift.
This Doppler effect allows astronomers to measure:
- The speed of stars orbiting in galaxies
- The rotation of stars and planets
- The expansion of the universe itself (Edwin Hubble used redshifts to show that galaxies are moving away from us, implying the universe is expanding)
4. Discovering Exoplanets
Spectroscopy plays a huge role in finding planets outside our solar system. By carefully monitoring a star’s spectrum, astronomers can detect the tiny wobbles caused by the gravitational tug of an orbiting planet. This radial velocity method has discovered hundreds of exoplanets.
5. Understanding Cosmic Evolution
By analyzing the light from distant galaxies and quasars, astronomers can peer billions of years into the past. The spectra of these ancient objects reveal how galaxies formed, how the first stars were made, and how the chemical elements necessary for life spread throughout the universe.
Beyond the Visible—Multi-Wavelength Spectroscopy
Visible light is just one part of the story. Spectroscopy extends across the entire electromagnetic spectrum, and each type of light tells us something different.
- Radio Spectroscopy: Reveals cold hydrogen gas in galaxies and the cosmic microwave background—the afterglow of the Big Bang.
- Infrared Spectroscopy: Penetrates dust clouds to show star-forming regions and planetary disks.
- Ultraviolet and X-ray Spectroscopy: Shows hot, energetic phenomena like supernovae, black holes, and active galactic nuclei.
- Gamma-ray Spectroscopy: Studies the most violent events in the universe, such as gamma-ray bursts and the formation of neutron stars.
The Future of Spectroscopy—New Frontiers and Technologies
Spectroscopy continues to evolve with new technologies and missions.
Space-Based Observatories
Telescopes like Hubble, James Webb Space Telescope (JWST), and Chandra X-ray Observatory have opened up entire new windows of light. JWST, in particular, is revolutionizing infrared spectroscopy, allowing us to study the atmospheres of exoplanets and the earliest galaxies.
Ground-Based Innovations
New spectrographs, like ESPRESSO on the VLT, can detect Earth-sized exoplanets by measuring stellar wobbles with unprecedented precision.
Future Projects
The Extremely Large Telescope (ELT) and Thirty Meter Telescope (TMT) will use massive mirrors and advanced spectroscopy to peer deeper into space and time than ever before.
Conclusion: Light Reveals All
Spectroscopy has transformed astronomy from simple stargazing into a precise and powerful science. It allows us to read the fingerprints of the cosmos, unlocking secrets from the tiniest atoms to the vast structure of the universe.
Every time you look at the stars, remember—they are sending us messages. Messages that, through the science of spectroscopy, we are learning to read. Messages that tell the story of creation, evolution, and the nature of reality itself.
In decoding starlight, we are truly listening to the universe.